Veterinarian Salary in Massachusetts: $145,769 (2026)
Quick Answer:Across Massachusetts's 59 metropolitan areas, the average median veterinarian pay sits at $145,769/year heading into 2026 — a figure projected from 2025 BLS OEWS wage data for SOC 29-1131. Because Massachusetts sits at BEA RPP 108.5 (9% above the U.S. baseline), that statewide median translates to roughly $134,349 in nationally-comparable purchasing power. Highest-paying metros: Barnstable Town ($164,060), Amherst Town ($163,630), Northampton ($161,464).
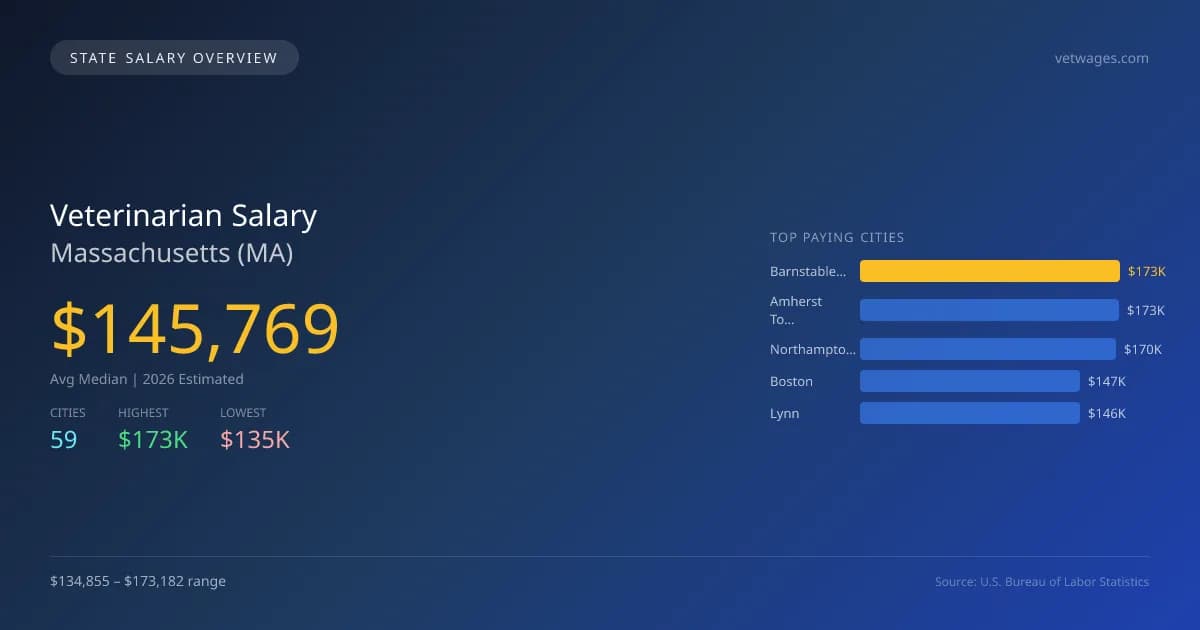
In 2026, the average median salary for veterinarians in Massachusetts is projected to be $145,769, surpassing the national median of $137,334 by 6.1%. The highest-paying city is Barnstable Town at $173,182, while the lowest is Andover at $134,855, reflecting a significant salary gap of $38,327. This difference can be attributed to various factors, including local cost of living, demand for veterinary services, and the concentration of pet ownership in certain areas. Massachusetts has specific state licensing requirements and scope of practice laws that can impact job opportunities and salary levels. The state's strong educational networks and high demand for skilled veterinarians contribute to a projected growth rate of 5.56% for the profession. With 2,647 veterinarians employed across its 59 metro areas, the job market remains stable, with top cities offering significant salaries: Barnstable Town, Amherst Town at $172,728, Northampton at $170,441, Boston at $146,623, and Lynn at $146,285. Factors such as urbanization and increased pet ownership continue to drive demand, creating a solid outlook for aspiring veterinarians in Massachusetts.
Massachusetts Veterinarian Salary Range
Overall salary range in Massachusetts: $79,747 (lowest entry-level) to $296,729 (highest top earner)
Massachusetts vs National Average
Massachusetts veterinarians earn 6.14% more than the national median (+$8,435/year difference).
Massachusetts Veterinarian Salary Distribution (2026)
Veterinarian salaries in Massachusetts range from $89,723 (entry-level, 10th percentile) to $269,649 (top earners, 90th percentile), with a median of $145,769. The Massachusetts median is $8,435 above the US national median of $137,334. The average hourly rate is $70.08/hr. Approximately 2,647 veterinarians are employed across 59 cities.
2019 BLS Actual
$100,282
2025 BLS Actual
$138,091
2026 Current Est.
$145,769
2019–2027 Growth
+53.4%
Salary Trajectory for Veterinarians in Massachusetts (2019–2027)
2019–2025: actual BLS OEWS data for this metro area. 2026+: CAGR 5.56% projection.
| Year | Annual Salary | Status |
|---|---|---|
| 2019 | $100,282 | Actual |
| 2020 | $103,929 | Actual |
| 2021 | $102,948 | Actual |
| 2022 | $124,576 | Actual |
| 2023 | $131,750 | Actual |
| 2024 | $136,390 | Actual |
| 2025 | $138,091 | Actual |
| 2026(current) | $145,769 | Estimated |
| 2027 | $153,874 | Projected |
Based on 7 years of BLS OEWS data for the Massachusetts metropolitan area, the median veterinarian salary grew 37.7% from $100,282 (2019) to $138,091 (2025). At a 5.56% compound annual growth rate, salaries are projected to reach $153,874 by 2027 — a total increase of $53,592 (53.44%) from 2019.
Note: Historical values (2019–2025) are actual BLS OEWS figures for the Massachusetts metropolitan area, sourced from annual Occupational Employment and Wage Statistics surveys. 2026–2026 figures are current estimates, and 2027 values are projections, calculated using a 5.56% CAGR derived from 7-year BLS historical data. Actual salaries may vary based on employer, experience, certifications, and local market conditions.
Top 5 Highest Paying Cities in Massachusetts
Lowest Paying Cities in Massachusetts
| City | Median Salary |
|---|---|
| Andover | $134,855 |
| Pittsfield | $135,022 |
| Leominster | $135,186 |
| Wellesley | $135,308 |
| Chelmsford | $135,385 |
Best Value Cities for Veterinarians in Massachusetts
When adjusted for local cost of living, these Massachusetts cities offer the most purchasing power for veterinarians.
| City | Nominal Salary | CoL Index | Adjusted Salary |
|---|---|---|---|
| Barnstable Town | $173,182 | 98.351 | $176,086 |
| Amherst Town | $172,728 | 100.243 | $172,309 |
| Northampton | $170,441 | 108.5 | $157,088 |
| Pittsfield | $135,022 | 95.106 | $141,970 |
| Springfield | $135,909 | 96.061 | $141,482 |
Adjusted salary = nominal salary × (100 / CoL index). CoL index: 100 = national average. Lower index = lower cost of living.
Salary by Experience Level in Massachusetts
| Experience Level | Estimated Annual |
|---|---|
| Entry Level (0-2 years) | $89,723 |
| Mid Career (3-7 years) | $145,769 |
| Experienced (7+ years) | $269,649 |
Estimates based on BLS percentile data averaged across Massachusetts metro areas. Individual pay varies by employer, certifications, and specialization.
All 59 Cities in Massachusetts
| # | City | Median Salary |
|---|---|---|
| 1 | Barnstable Town | $173,182 |
| 2 | Amherst Town | $172,728 |
| 3 | Northampton | $170,441 |
| 4 | Boston | $146,623 |
| 5 | Lynn | $146,285 |
| 6 | Newton | $145,444 |
| 7 | Somerville | $144,370 |
| 8 | Revere | $144,144 |
| 9 | Brockton | $143,649 |
| 10 | New Bedford | $143,489 |
| 11 | Plymouth | $143,400 |
| 12 | Cambridge | $143,121 |
| 13 | Malden | $142,881 |
| 14 | Haverhill | $142,859 |
| 15 | Lowell | $142,822 |
| 16 | Framingham | $142,756 |
| 17 | Peabody | $142,565 |
| 18 | Weymouth | $142,137 |
| 19 | Chicopee | $141,708 |
| 20 | Randolph | $141,553 |
| 21 | Quincy | $141,302 |
| 22 | Amherst | $141,133 |
| 23 | Chelsea | $141,121 |
| 24 | Medford | $140,738 |
| 25 | Fall River | $140,602 |
| 26 | Marlborough | $140,602 |
| 27 | Watertown | $140,580 |
| 28 | Fitchburg | $140,470 |
| 29 | Methuen | $140,416 |
| 30 | Taunton | $140,354 |
| 31 | Arlington | $140,304 |
| 32 | Needham | $139,939 |
| 33 | Westfield | $139,872 |
| 34 | Everett | $139,850 |
| 35 | Holyoke | $139,132 |
| 36 | Beverly | $138,900 |
| 37 | Lawrence | $138,899 |
| 38 | Dartmouth | $138,734 |
| 39 | Waltham | $138,594 |
| 40 | Barnstable | $138,447 |
| 41 | Worcester | $138,231 |
| 42 | Brookline | $138,143 |
| 43 | Billerica | $137,928 |
| 44 | Braintree | $137,463 |
| 45 | Salem | $137,231 |
| 46 | Natick | $137,142 |
| 47 | Dracut | $136,425 |
| 48 | Lexington | $136,336 |
| 49 | Stoughton | $136,336 |
| 50 | Shrewsbury | $136,159 |
| 51 | Springfield | $135,909 |
| 52 | Franklin | $135,794 |
| 53 | Attleboro | $135,684 |
| 54 | Woburn | $135,507 |
| 55 | Chelmsford | $135,385 |
| 56 | Wellesley | $135,308 |
| 57 | Leominster | $135,186 |
| 58 | Pittsfield | $135,022 |
| 59 | Andover | $134,855 |
More Massachusetts Salary Data
Hourly Rates
Explore veterinarian hourly pay in Massachusetts cities.
Senior / Experienced
Top earner salaries for experienced veterinarians.
Compare Cities in Massachusetts
View all comparisons →Explore More Veterinarian Salary Data
Frequently Asked Questions
How much do veterinarians make in Massachusetts in 2026?
What is the highest paying city for veterinarians in Massachusetts?
How does Massachusetts veterinarian pay compare to the national average?
What is the entry-level veterinarian salary in Massachusetts?
How many veterinarians are employed in Massachusetts?
Which Massachusetts city offers the best value for veterinarians?
Written by Dr. Alice Nguyen, DVM
Career Analyst
Dr. Alice Nguyen has 10 years of experience in veterinary medicine. She specializes in small animal surgery. She currently works at a suburban veterinary clinic.
Methodology & Data Source
Statewide salary figures on this page are 2026 projections based on the Bureau of Labor Statistics Occupational Employment and Wage Statistics (OEWS) survey, May 2026 release. A 5.56% compound annual growth rate (CAGR), derived from 6-year national BLS wage trends, was applied to each metro area's reported salary to estimate current 2026 veterinarian compensation across Massachusetts. State averages are employment-weighted across 59 metro areas — larger metro areas with more veterinarianscontribute proportionally more to the average, producing figures that better reflect typical compensation. Individual pay varies by city, employer, certifications, and experience.
Data Sources & Methodology
Source: BLS, OEWS, 7-year dataset (–). Per-city data from annual BLS metropolitan area surveys.
2026 figures are projected from 2025 BLS data using a compound annual growth rate (CAGR) of 5.56%, derived from historical BLS wage trends for veterinarians (SOC 29-1131).
Compiled and verified by Dr. Alice Nguyen, DVM, a licensed veterinarian with 10+ years of clinical experience. · View source data at BLS.gov