Veterinarian Salary in Vermont: $138,014 (2026)
Quick Answer:Across Vermont's 9 metropolitan areas, the average median veterinarian pay sits at $138,014/year heading into 2026 — a figure projected from 2025 BLS OEWS wage data for SOC 29-1131. Because Vermont sits at BEA RPP 103.5 (4% above the U.S. baseline), that statewide median translates to roughly $133,347 in nationally-comparable purchasing power. Highest-paying metros: South Burlington ($132,490), Burlington ($131,820), Bennington ($129,030).
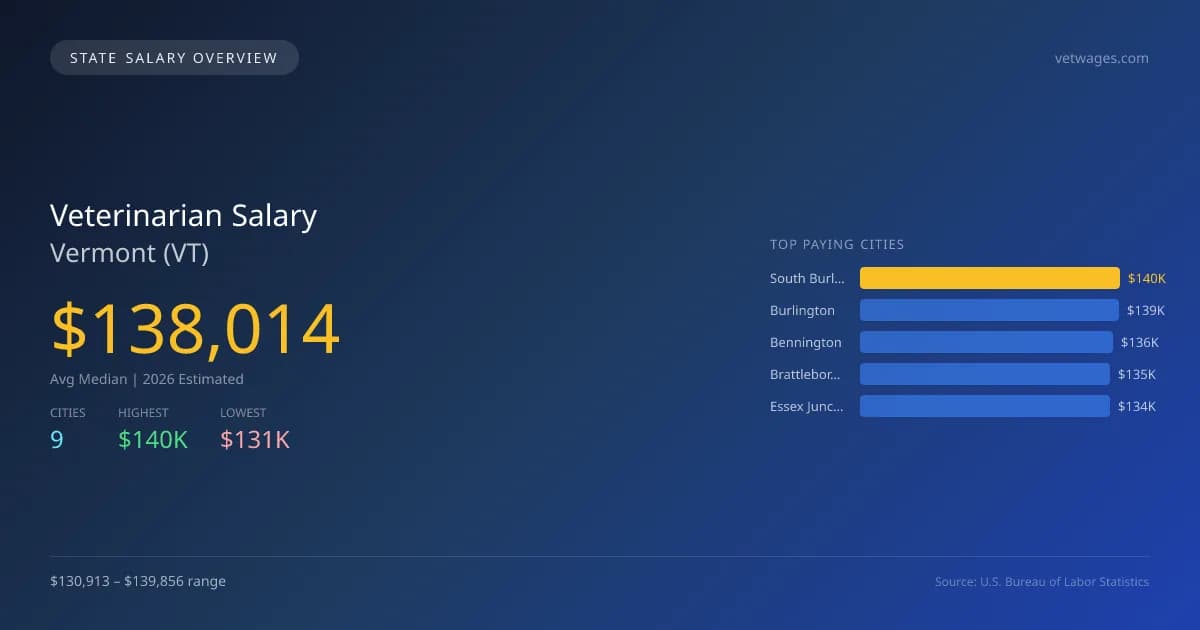
In 2026, the average median salary for veterinarians in Vermont is projected to be $138,013, which is slightly above the national median of $137,334, showing a 0.5% advantage. The salary range within the state varies, with South Burlington offering the highest salary at $139,856, while Montpelier presents the lowest at $130,913, creating a gap of $8,943. This disparity is driven by factors such as local demand for veterinary services, cost of living variations, and regional economic conditions. Vermont has specific licensing requirements that veterinarians must meet, along with scope of practice laws that allow for diverse responsibilities in animal healthcare. The state has a steady demand for veterinary services, driven by pet ownership rates and agricultural needs, contributing to a job market growth rate of 5.56% annually. The total number of employed veterinarians in Vermont is currently at 170, and prominent cities for veterinarians include Burlington at $139,149, Bennington at $136,204, Brattleboro at $134,665, and Essex Junction at $134,377. Overall, the job market for veterinarians in Vermont remains strong, making it a viable state for pursuing a career in veterinary medicine.
Vermont Veterinarian Salary Range
Overall salary range in Vermont: $77,834 (lowest entry-level) to $228,749 (highest top earner)
Vermont vs National Average
Vermont veterinarians earn 0.50% more than the national median (+$680/year difference).
Vermont Veterinarian Salary Distribution (2026)
Veterinarian salaries in Vermont range from $93,860 (entry-level, 10th percentile) to $223,739 (top earners, 90th percentile), with a median of $138,014. The Vermont median is $680 above the US national median of $137,334. The average hourly rate is $66.36/hr. Approximately 170 veterinarians are employed across 9 cities.
2019 BLS Actual
$86,110
2025 BLS Actual
$130,744
2026 Current Est.
$138,014
2019–2027 Growth
+69.2%
Salary Trajectory for Veterinarians in Vermont (2019–2027)
2019–2025: actual BLS OEWS data for this metro area. 2026+: CAGR 5.56% projection.
| Year | Annual Salary | Status |
|---|---|---|
| 2019 | $86,110 | Actual |
| 2020 | $96,190 | Actual |
| 2021 | $100,400 | Actual |
| 2022 | $103,771 | Actual |
| 2023 | $119,690 | Actual |
| 2024 | $153,921 | Actual |
| 2025 | $130,744 | Actual |
| 2026(current) | $138,014 | Estimated |
| 2027 | $145,687 | Projected |
Based on 7 years of BLS OEWS data for the Vermont metropolitan area, the median veterinarian salary grew 51.8% from $86,110 (2019) to $130,744 (2025). At a 5.56% compound annual growth rate, salaries are projected to reach $145,687 by 2027 — a total increase of $59,577 (69.19%) from 2019.
Note: Historical values (2019–2025) are actual BLS OEWS figures for the Vermont metropolitan area, sourced from annual Occupational Employment and Wage Statistics surveys. 2026–2026 figures are current estimates, and 2027 values are projections, calculated using a 5.56% CAGR derived from 7-year BLS historical data. Actual salaries may vary based on employer, experience, certifications, and local market conditions.
Top 5 Highest Paying Cities in Vermont
Lowest Paying Cities in Vermont
| City | Median Salary |
|---|---|
| Montpelier | $130,913 |
| Colchester | $131,576 |
| Rutland | $131,726 |
| Barre | $134,195 |
| Essex Junction | $134,377 |
Best Value Cities for Veterinarians in Vermont
When adjusted for local cost of living, these Vermont cities offer the most purchasing power for veterinarians.
| City | Nominal Salary | CoL Index | Adjusted Salary |
|---|---|---|---|
| Burlington | $139,149 | 100.949 | $137,841 |
| South Burlington | $139,856 | 103.5 | $135,127 |
| Bennington | $136,204 | 103.5 | $131,598 |
| Brattleboro | $134,665 | 103.5 | $130,111 |
| Essex Junction | $134,377 | 103.5 | $129,833 |
Adjusted salary = nominal salary × (100 / CoL index). CoL index: 100 = national average. Lower index = lower cost of living.
Salary by Experience Level in Vermont
| Experience Level | Estimated Annual |
|---|---|
| Entry Level (0-2 years) | $93,860 |
| Mid Career (3-7 years) | $138,014 |
| Experienced (7+ years) | $223,739 |
Estimates based on BLS percentile data averaged across Vermont metro areas. Individual pay varies by employer, certifications, and specialization.
All 9 Cities in Vermont
| # | City | Median Salary |
|---|---|---|
| 1 | South Burlington | $139,856 |
| 2 | Burlington | $139,149 |
| 3 | Bennington | $136,204 |
| 4 | Brattleboro | $134,665 |
| 5 | Essex Junction | $134,377 |
| 6 | Barre | $134,195 |
| 7 | Rutland | $131,726 |
| 8 | Colchester | $131,576 |
| 9 | Montpelier | $130,913 |
More Vermont Salary Data
Hourly Rates
Explore veterinarian hourly pay in Vermont cities.
Senior / Experienced
Top earner salaries for experienced veterinarians.
Explore More Veterinarian Salary Data
Frequently Asked Questions
How much do veterinarians make in Vermont in 2026?
What is the highest paying city for veterinarians in Vermont?
How does Vermont veterinarian pay compare to the national average?
What is the entry-level veterinarian salary in Vermont?
How many veterinarians are employed in Vermont?
Which Vermont city offers the best value for veterinarians?
Written by Dr. Alice Nguyen, DVM
Career Analyst
Dr. Alice Nguyen has 10 years of experience in veterinary medicine. She specializes in small animal surgery. She currently works at a suburban veterinary clinic.
Methodology & Data Source
Statewide salary figures on this page are 2026 projections based on the Bureau of Labor Statistics Occupational Employment and Wage Statistics (OEWS) survey, May 2026 release. A 5.56% compound annual growth rate (CAGR), derived from 6-year national BLS wage trends, was applied to each metro area's reported salary to estimate current 2026 veterinarian compensation across Vermont. State averages are employment-weighted across 9 metro areas — larger metro areas with more veterinarianscontribute proportionally more to the average, producing figures that better reflect typical compensation. Individual pay varies by city, employer, certifications, and experience.
Data Sources & Methodology
Source: BLS, OEWS, 5-year dataset (–). Per-city data from annual BLS metropolitan area surveys.
2026 figures are projected from 2025 BLS data using a compound annual growth rate (CAGR) of 5.56%, derived from historical BLS wage trends for veterinarians (SOC 29-1131).
Compiled and verified by Dr. Alice Nguyen, DVM, a licensed veterinarian with 10+ years of clinical experience. · View source data at BLS.gov